Note: There are collar, survey and assay csv files, plus a raster DEM in the testdata directory under the plugin installation directory in case you just want to test the drill hole functions of Geoscience (Hint, open the DEM raster first to set the CRS). Some of the holes in these files aren't particularly realistic because they are used for testing unusual situations.
Tools to display drill holes, down hole data and sections in QGIS.
This includes desurveying the holes using collar azimuth and dip and/or survey data. Prior to using Drill Tools you need to open the collar, survey (optional) and down hole data (optional) tables in QGIS. You can use any format supported by QGIS including shapefiles, MapInfo Tab files or CSV files (Note: Geoscience doesn't support database layers yet. If your data is in a database, first export your layers as Geopackage, Shapefile etc). To open data using CSV, use the existing QGIS Delimited Text tool.
Important: Drill Tools will only work with projected coordinate systems (ie not latitude and longitude).
Geoscience will create new layers with names based on the original file names. It's suggested to give your original files short, simple names (eg. Collar.shp, Assay.csv etc). Once Geoscience has created a file name then you shouldn't change it because Geoscience might not be able to identify the file again.
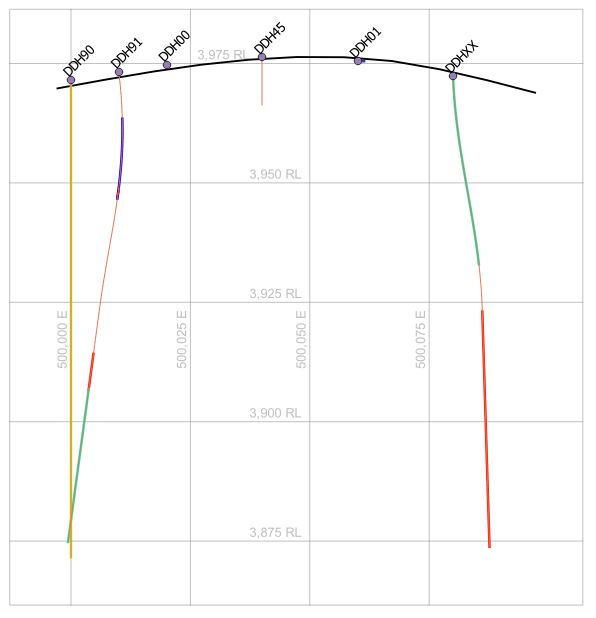
The workflow to display the surface projection of drill traces follows. You will also need to do this if you want to display sections.
Load Data
- Open the Collar layer. If using the Delimited Text tool in QGIS , select Point Geometry and the appropriate columns for Easting and Northing, followed by the Coordinate Reference System.
- (Optional) Open the Survey layer. If using the Delimited Text tool in QGIS, select No Geometry to just import the data columns.
- (Optional) Open the Down hole data layers. You can use multiple layers (eg. lithology and assay) and if you are using the Delimited Text tool in QGIS, select No Geometry to just import the data columns.
Desurvey Holes
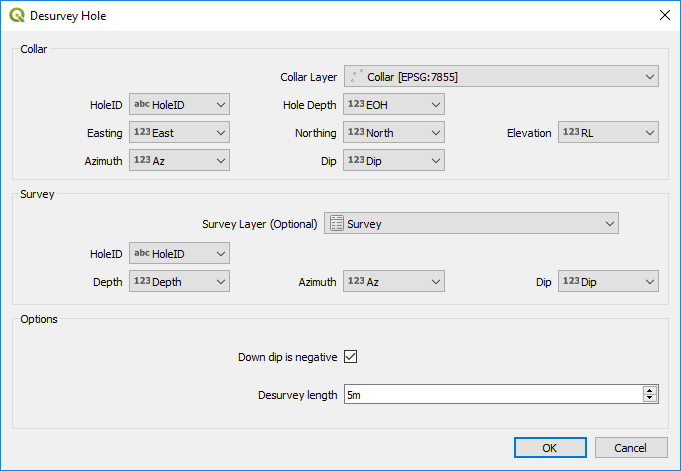
- Choose Geoscience -> Drilling -> Desurvey Data or click the
 button on the toolbar. Select the appropriate fields. Note that all fields will be guessed by Geoscience if sensible names have been used. Choose the Desurvey Length. Drill holes will be reconstructed using straight line segments of this length. Click OK and a new layer is created and loaded in QGIS. You can now see the surface projection of drill holes.
Process Downhole Data
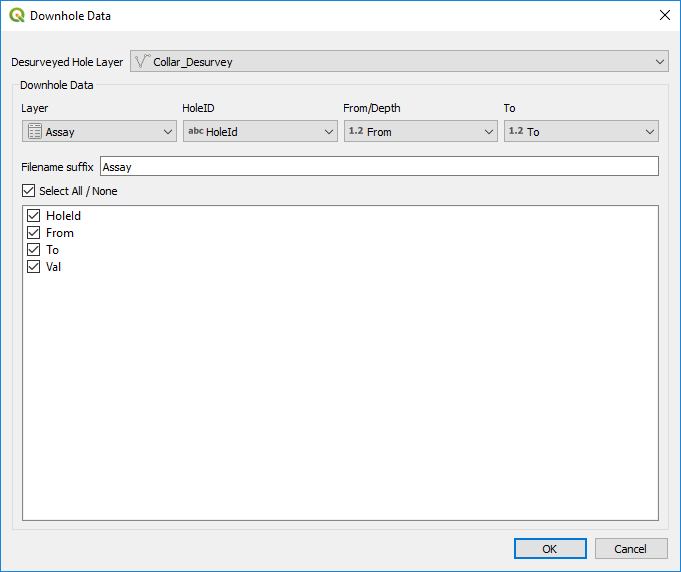
- Choose Geoscience -> Drilling -> Downhole Data or click the
 button on the toolbar.
 - Select the desurveyed hole layer. You can have multiple sets of drill hole data loaded at once.
- Choose the source Downhole Data layer and the appropriate attribute fields for HoleiD, From and To. These are chosen automatically if sensible names are used.
- Check all the attribute fields that you want to include in the downhole data layer to be created. You will use these for symbology on the line segments, so be sure to include any attributes that you will need.
- You also need to provide a brief descriptive name to be appended to the layer name. A default is provided, but this will depend on how your layers are named.
- The downhole data layer is created using the name "CollarLayerName_Downhole_NameFromStepAbove", then loaded into QGIS. Each row contains one polyline for each From-To interval from the source layer.
- Symbolise the new layer to display the attributes as you desire using the normal QGIS tools.
Sections
Sections are generated by defining start and end coordinates, a section width and which layers to include in the section. Sections will be transformed to a new coordinate system based on distance along the section from the start point and the real elevation as calculated in the Desurvey stage. This means that your sections are displayed on the same map canvas as the rest of your data. Usually this will be in a different part of space to your normal, plan-based spatial data and won't be a problem. If your regular data uses coordinates near 0E, 0N, then you might want to move it all under a single group in the Layer Tree so that you can switch it on and off easily. All sections will be placed in their own Section group automatically.
Geoscience will store all the metadata required to recreate a section in your QGIS Project file. Generated section layers are only Memory Layers and will be lost when QGIS is closed, however they can easily be regenerated from the Section Manager when you open your project again. Similarly, you can remove sections from the Layer Tree and then regenerate them later. The only way to delete sections permanently is via the Section Manager.
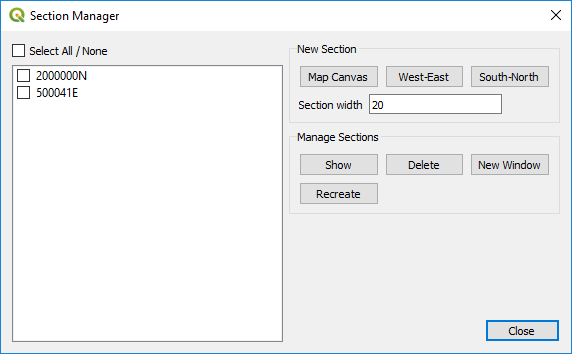
The Section Manager displays all sections in the box on the left. You can double click sections in the box to display them. Also, the Section layer tree group is set as mutually exclusive, so you can switch between sections by clicking their groups on and off.
You can Recreate or Delete multiple sections by selecting their check boxes before clicking the appropriate buttons. When you recreate a section, Geoscience will replace any existing empty Memory Layers already in the section's group in the layer tree. This allows you to have extra layers, such as interpretation layers, under the section group. The Geoscience section layers will just be recreated around them.
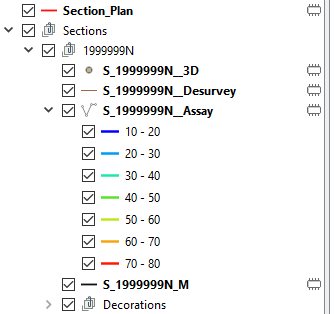
Geoscience will create a top level Group called Sections. All sections you create will be placed under this in their own groups so that you can switch entire sections on and off.
Sections are normal QGIS layers. You can use any of the Symbology, labelling tools etc as normal. You can also create a Layout to produce scaled and annotated plots.
Geoscience will generate three grids and a border with every section. These are placed in a Decorations group so that they can be toggled on and off together. The three grids show where lines of Easting, Northing and Elevation cross the section line. If your section is close to west-east or south-north then one of the grids will be turned off by default. You can turn any of the three grids or border on or off independently.
To generate and display sections.
- When a section is created, Geoscience copies the style from your down hole data layers to the new section. You should therefore make sure that you are happy with your down hole data styles before generating sections. Note that you can change the down hole data style later, then regenerate the sections to update the section styles if required, but better to get it right the first time.
- Open the Section Manager by choosing Geoscience -> Drilling -> Section Manager or click the
 button on the toolbar.
 - Type in your desired section width.
- You have three options to create a section:
- Map Canvas - Use the mouse to draw a section line on the map canvas.
- West-East - Type in the Northing plus start and end Easting for the section.
- South-North - Type in the Easting plus start and end Northing for the section.
- If Map Canvas is chosen, you then click and drag a section to define the end points. Geoscience will display a moving box of defined section width to assist you. Your section is defined when you release the mouse button.
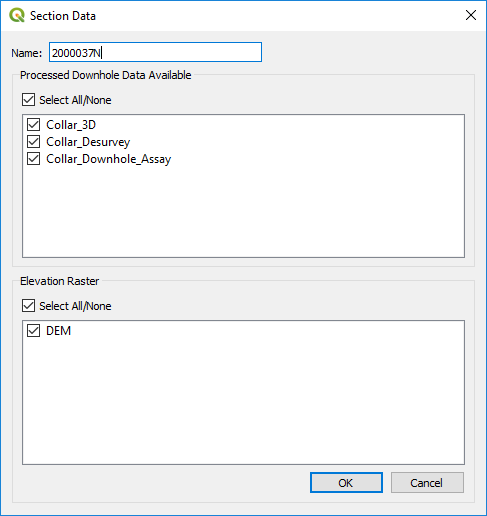
- Once a Map Canvas section is defined, or when you choose to define an orthogonal section, a dialog will ask you to select which vector and raster layers you want to include and choose a name for the section. Check the boxes next to the desired levels then click OK. Note that only vector layers with 3D coordinates and single band raster layers are displayed.
- It may take some time to generate the section depending on how many drill holes you have. Once completed, a new drill hole will be added to the Section Manager, a new group containing your section is added to the Layer Tree and the Map Canvas will zoom to your new section.