Drill holes are not straight! You would be surprised at just how much a drill hole can bend. If we want to correctly know where our down hole samples are are taken from in 3D space, we need to map the curvature of the hole. To do this, we measure the dip and azimuth of the drill hole at a number of depths down the hole, then "desurvey" the hole to track its path through the ground.
We build up the drill hole path with a series of straight line segments. Each segment has a length and a direction. We start at the collar coordinate and calculate the 3D position of the first line segment. The second line segment starts at the end of the first, then we calculate the end of second segment using an updated direction. This is all very simple, but the tricky bit is calculating the rotation of each line segment.
We know the hole direction at one or more points, usually one of these points is the collar. If this is the only directional information we have then Geoscience will assume the hole is straight. The collar direction can be included as a dip and azimuth column in the collar file or as line in the survey file at 0 depth. Below is an example of a csv survey file.
HoleID, Depth, Az, Dip
DDH01, 0, 10, 0
DDH01, 50, 350, 0
DDH91, 0, 45, -80
DDH91, 50, 230, -80
DDHXX, 0, 10, -80
DDHXX, 50, 170, -80
from the 'testdata' directory under your Geoscience plugin installation.
It's also possible to put a tool down the hole and measure the dip and azimuth at different depths. This allows us to track the path of the hole more thoroughly. Data sampling rules still apply and you need to have your survey readings close enough to represent the curvature of the hole.
Survey measurements are put in the survey file with columns for HoleID, Depth, Dip and Azimuth. These will be combined with any dip and azimuth readings in the collar file, then sorted by depth. Geoscience needs a survey defined for the top (collar) and bottom of the hole, so if you don't already have one the plugin will repeat the nearest available. Note that if there are no surveys for a hole then it will be assumed to be vertical.
We can define the dip and azimuth of drill hole segments at known survey points as a rotation from a horizontal line pointing north (ie 0 azimuth and 0 dip). This rotation is represented as a quaternion.
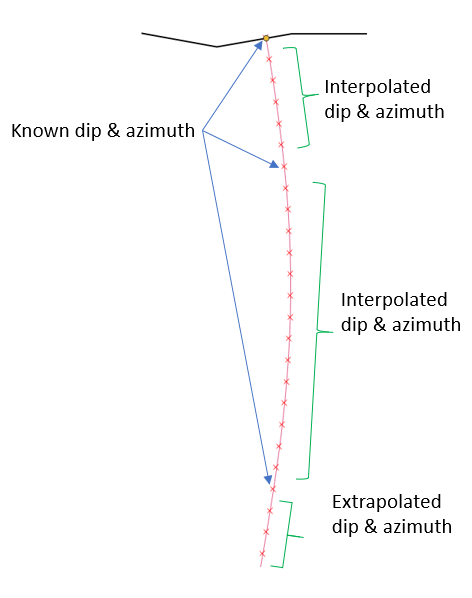
So, we now have a quaternion to describe the rotation (dip and azimuth) for each drill hole segment at a known down hole survey point, including the top and bottom of the hole. We still need to know the rotation for all the segments in between. We could maintain the same rotation until we hit a new known point, but that doesn't seam very realistic. Holes don't go straight and then kink. It's much more likely that the rotation with change smoothly from one known point to the next.
Quaternions have a very useful feature in that they can be linearly interpolated between two values. This is known as a Spherical Linear Interpolation, or SLERP. Geoscience uses this to figure out the rotation (dip and azimuth) of each drill hole segment in between the known points.
It's important to understand that it is not the position of the segments that are interpolated. There is a linear interpolation of the rotation.
Once we known the length (set by the "Desurvey length" parameter in the Desurvey dialog) and rotation of each line segment then it is a simple matter to calculate the offset of that segment and add it on to the end of the last segment. All you need to supply is the collar location and the depth, dip and azimuth at your known points.
Desurveying in Geoscience is done with full 3D coordinates. The CollarName_Desurvey.gpkg file generated by this process contains a single row for each drill hole and the geometry for that row is a polyline. Each node of the polyline is one of the calculated points discussed above and consists of a 3D coordinate. When the polyline is displayed in plan the Z coordinate is ignored and the polyline is projected to surface. When we come to process our down hole data (assays, lithology etc), Geoscience will do a linear interpolation between desurveyed nodes, based on the sample depth, to calculate the sample 3D coordinates. Likewise, when it comes to cutting sections through the data we can use the full 3D coordinates to figure out what needs to be shown and generate section coordinates - that's the topic of another post!